Data Illustrations Kayma
Data Illustrations
Kayma is a heat counter, an object able to detect and modify the temperature inside a home where there is a central heating.
An apartment with central heating is totally devoid of autonomy in...
From Amman to Torino Information Design in Action Workshop تصميم المعلومات في عمان
"Information Design in action" workshop with Chiara Alduini!
Art event in Amman, Jordan
The workshop aims to facilitate the acquirement of new communication methods and transfer new techniques of design in the field of information design....
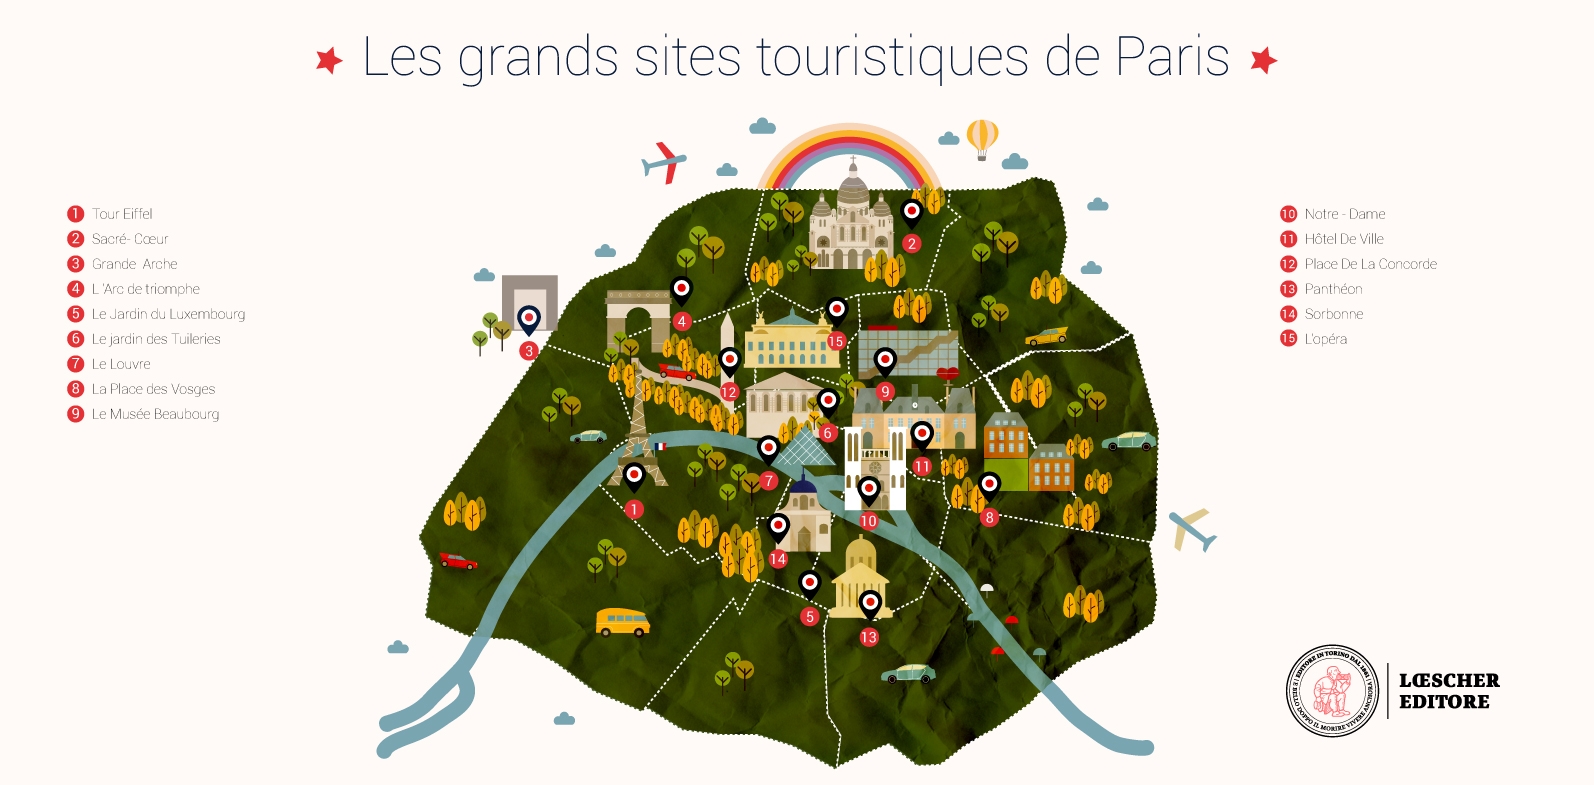
Illustration: Top 15 Places to Visit in Paris
C'est La Classe! language course book
Top 15 Places to Visit in Paris, Tour Eiffel, Sacré- Cœur, Grande Arche, L ’Arc de triomphe, Le Jardin du Luxembourg, Le...
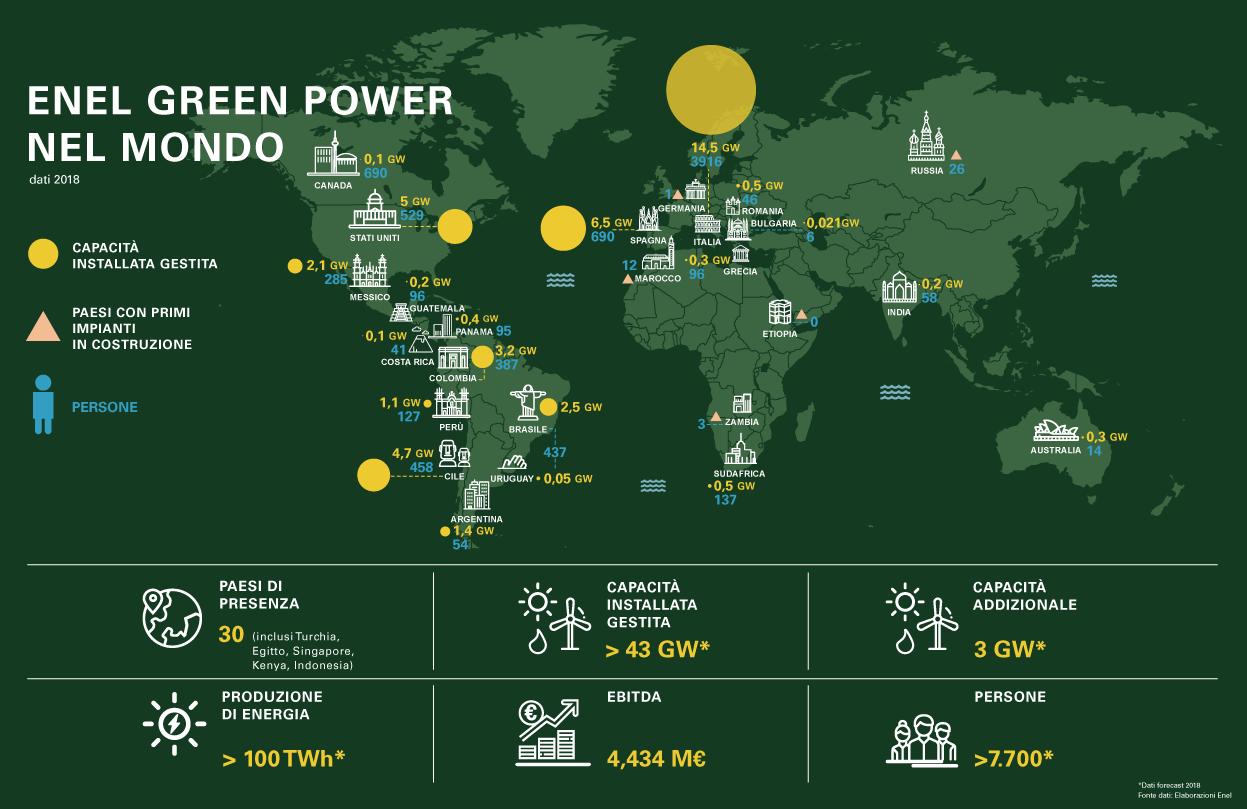
ENEL GREEN POWER Magazine infographics
EGP Magazine infographics, the data show the global activity of Enel Green Power.
The customer needed to show up a series of data in a single image.
The world map showed the various Enel plants both...
University of Ohio
This map was commissioned by The University of Ohio Communication and Marketing College.
The illustration was use to promote turism and was publish at the Ohio University Alumni Magazine.
Each attraction has been designed down to...
Reply SDA Bocconi DEVO Lab Data Robotics, AI
Social Media:
Ai illustrations Data Robotics, artificial...
Railab Brand Identity
A unique brand identity, with a strong personality, the core business of Railab is provide innovative solutions in Robotics and Automation fields.
Railab web...
THE DATA INCUBATOR INFOGRAPHICS
Big Data Infographics:
A series of infographics and illustrations "How to become a data scientist" (Big Data technologies, and the use of advanced Machine Learning models.)
Reply has signed an exclusive agreement with The Data Incubator,...